In simple words, Revenue is the price paid by a consumer for any commodity. Revenue refers to the total income generated by a business through its normal operations, typically from sales of goods or services. It is calculated by multiplying the quantity of goods or services sold by their respective prices. There are different types of revenue, such as total revenue (TR), overall income, and marginal revenue (MR), representing the additional revenue from selling one more unit.
Concept of Total, Average, and Marginal Revenue
Revenue can be defined as receipt or returns from the sale of products of an organization. In other words, Revenue is the income that an organization receives from normal business activities. Revenue refers to the amount a firm receives from the sale of a given quantity of a commodity in the market.
Dooley: “The revenue of a firm is its sales receipt from the sale of a product”.
Thus, Revenue (R) is the function of price (P) and quantity sold (Q). Symbolically, R=f(P,Q)
The concept of revenue consists of three important terms; Total, Average, and Marginal revenue.
Total revenue (TR)
The income earned by a seller or producer after selling the output is called the total revenue. Total revenue is the multiple of price and output. The behavior of total revenue depends on the market where the firm produces or sells.
Dooley: “Total revenue is the sum of all sales, receipts, or income of a firm”.
Clower and Due: It may be defined as the “product of planned sales (output) and expected selling price”.
Stonier and Hague: “Total revenue at any output is equal to the price per unit multiplied by the quantity sold.
Total revenue is the firm’s total earnings per period from the sale of a particular amount of output (Q). Thus,
TR = P * Q = AR * Q
Where, TR = Total Revenue
AR (=P) = Average revenue or price per unit
Q = Output
Average Revenue (AR)
Average revenue refers to the revenue obtained by the seller by selling the per unit commodity. It is obtained by dividing the total revenue by the total output.
Stonier and Hague: The average revenue curve shows that the price of the firm’s product is the same at each level of output.
McDonnell, Average revenue is the per unit revenue received from the sale of one unit of a commodity.
Average revenue is the amount the firm earns per unit sold. Thus,
AR = Total revenue/ Number of units sold =TR/Q=P*Q/Q=P
and P=f(Q) is an average curve that shows that price is a function of quantity demanded. It is also a demand curve.
Marginal revenue(MR)
Marginal revenue is the net revenue obtained by selling an additional unit of the commodity. It is the extra total revenue gained by selling one more unit (per time period).
Ferguson points out that, “Marginal revenue is the change in total revenue which results from the sale of one more or one less unit of output.”
A. Koutsoyiannis, “The marginal revenue is the change in total revenue resulting from selling an additional unit of the commodity.”
In algebraic terms, marginal revenue is the net addition to the total revenue by selling a unit of a commodity instead of n-.
Therefore,
MR= Change in total revenue/Change in quantity sold
MRn = TRn – TRn-1
Whereas, TRn= Total revenue of ‘n’ units
TRn=Total revenue from (n-1) units
MRn= Marginal revenue from nth term
n = any given number
MR is also the first derivative of TR.
Derivation of Average and Marginal Revenue Curve from Total Revenue Curve Under Perfect Competition and Monopoly Market
The relationships of revenues – AR, MR, and TR will depend on the market conditions under which a firm operates. Let us now examine the nature of revenue curves under different market situations:
Revenue Curve under Perfect Competition
A firm under perfect competition is a price-taker. This simply means it can alter its volume of output and sales level without significantly affecting the market price of its product. At the prevailing market (ruling) price it can sell as much as it likes. This means that the demand for its product is completely elastic at a particular (market-determined) price. As R.G. Lipsey put it, “The demand curve facing each firm in perfect competition is horizontal, because variations in the firm’s output over the range that it needs to consider have no noticeable effect on price”.
Thus, in perfect competition, an individual firm is a price taker because the price is determined by the collective forces of market demand and supply which are not influenced by the individual. When the price is the same for all units of a commodity, naturally AR (Price) will be equal to MR i.e., AR = MR. The revenue schedule for a competitive firm is shown in the table.
| Units sold (Q) | P= AR | TR= P*Q | MR= TRn-TRn-1 |
|---|---|---|---|
| 1 2 3 4 5 | 5 5 5 5 5 | 5 10 15 20 25 | 5 5 5 5 5 |
In the table we find that as output increases, AR and MR remain the same i.e. Rs. 5. Total revenue increases but at a constant rate. Thus,
TR=AR*Q
Also, TR=MR*Q
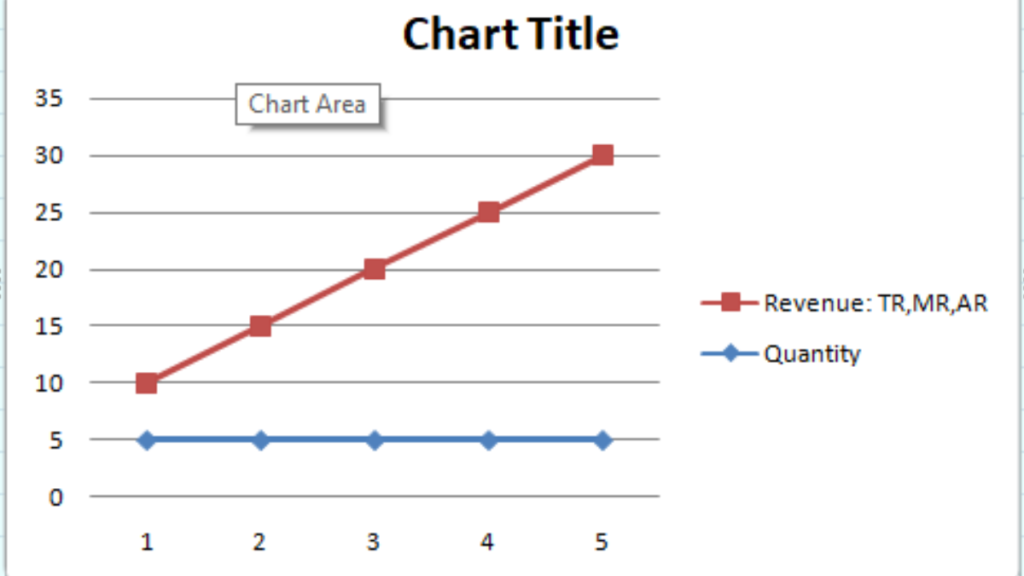
In the figure, on the X-axis, we take quantity whereas on Y-axis, we take revenue.
TR. The table shows the effect on total revenue of different levels of sales with a constant price of Rs. 5 per unit. As the price is constant, total revenue will rise at a constant rate as more is sold. The TR curve will therefore be a straight line as in figure.
MR and AR. In the case of a horizontal demand curve, the marginal revenue curve (MR) will be the same as the average revenue curve (AR), since selling one more unit at a constant price (P) merely adds that amount to total revenue. If an extra unit is sold at a constant price of Rs. 5, an extra Rs. 5 is earned.
Revenue Curve under Monopoly Market
The three curves (TR, AR, and MR) look quite different when the price does vary with the firm’s (monopoly) output. If a firm has a relatively large share of the market, it will face a downward-sloping demand curve. This means that if it is to sell more, it must lower the price. It could also choose to raise its price. If it does so, however, it will have to accept a fall in sales.
Under monopoly conditions, total revenue increases at a diminishing rate. It becomes maximum and then begins to decline. The position of various revenue curves is sketched in the following table.
| Unit sold (Q) | Price (P) | TR =P*Q | AR =TR/Q | MR = TRn-TRn-1 |
|---|---|---|---|---|
| 1 2 3 4 5 | 6 5 4 3 2 | 6 10 12 12 10 | 6 5 4 3 2 | 6 4 2 0 -2 |
In the table, 2 units can be sold at a unit price of Rs. 5, bringing in total revenue of Rs. 10. When 3 units are sold, the price per unit is lowered to Rs. 4 to make it possible for larger quantities to be sold. The total revenue in this case is Rs. 12. The marginal unit is not bringing in Rs. 4 which is its price, but only Rs. 2. This is because the additional one unit is sold at Re. one less and the first 2 units which could have been sold for Rs. 5 are also sold at Rs. 4 i.e., Re 1 less.
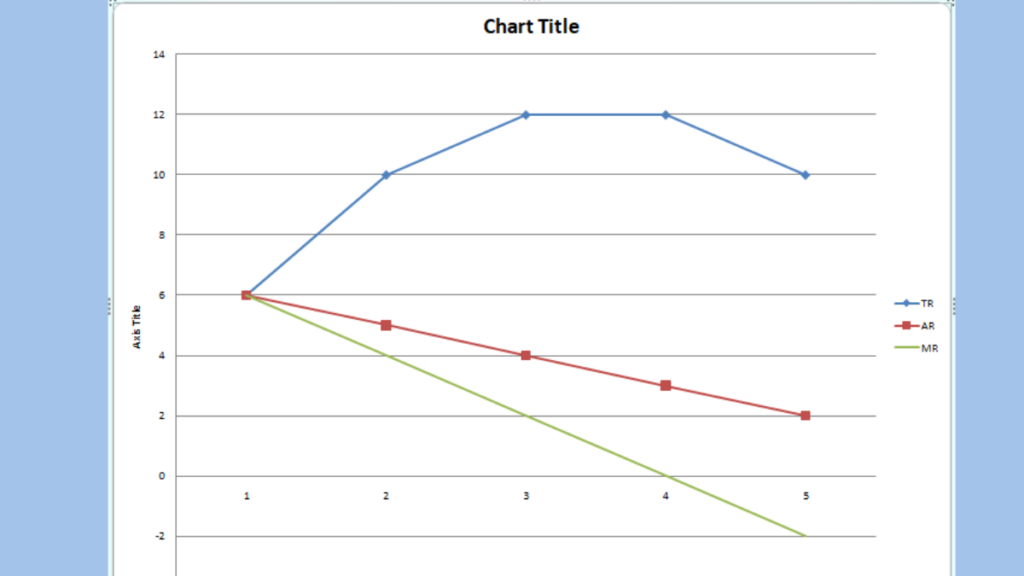
Here, x axis represents the quantity and y-axis is the revenue axis.
TR. Unlike the case of a price-taking firm, the TR curve is not a straight line. It is a curve that rises at first and then falls. The TR curve will be an arch shape starting from the origin. As long as marginal revenue is positive (and hence demand is price elastic), a rise in output will raise total revenue. However, once marginal revenue becomes negative (and hence demand is inelastic), total revenue will fall. The peak of the TR curve will be where MR=0. At this point, the price elasticity of demand will be equal to 1. In figure, at 4^{\circ} unit TR is maximum and MR is zero, thereafter it diminishes.
MR. The MR curve will also slope downwards but will be below the AR curve and steeper than it. The figure shows that additional units are sold when a price comes down not only for the marginal units but also for other previous units. As a result, marginal units do not bring revenue equal to its price. MR is continuously diminishing and negative after 4^{m} unit.
AR. A firm that faces a downward-sloping demand curve must also face the same downward-sloping AR curve. AR curve also falls from initially but it lies above the MR and is non-negative at every level of unit sold.
3 thoughts on “What is Revenue?”